From October 2018 to January 2019, I took an online digital marketing nano-degree program from Udacity. I wanted to bolster my marketing skillsets especially when it came down to launching creative campaigns and evaluating success.
The course started with a focus on how to understand the costumers that align with what your business provides. Then using that info to create a one liner that lays out the company's value proposition.
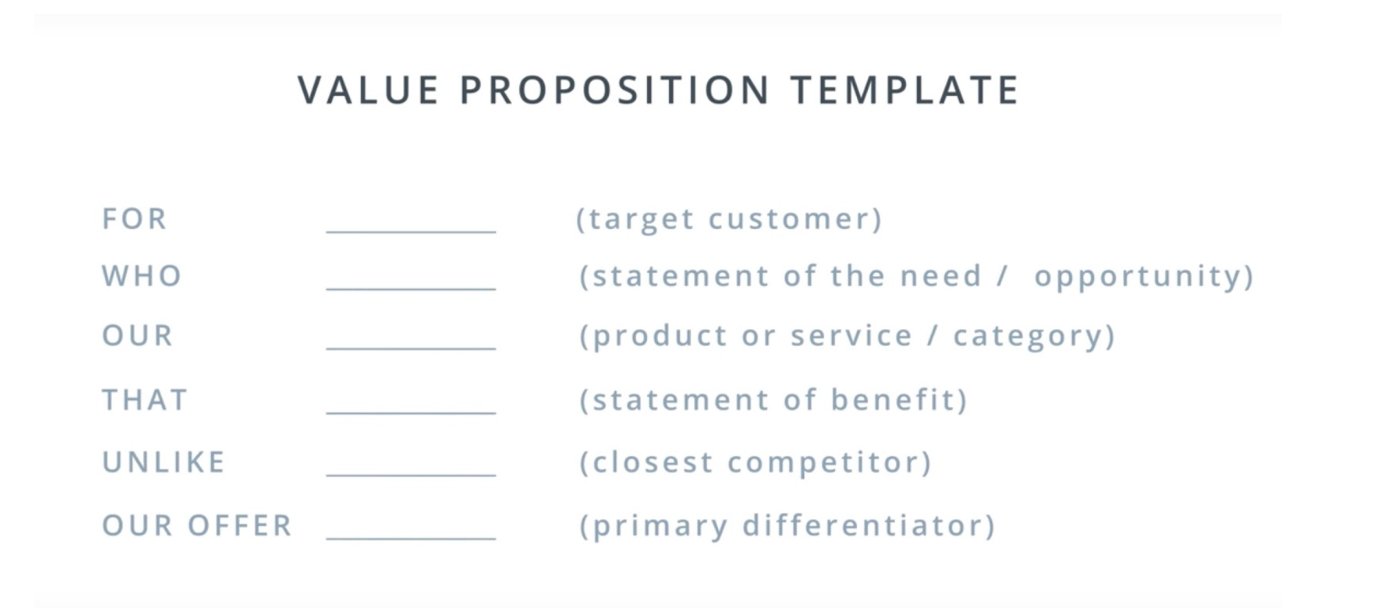
In my case I was selling the Udacity online program and so my one liner was:
For career focused individuals who are interested in the marketing field, our online nanodegree program offers valuable technical and career marketing skills unlike other online marketing programs like Hubspot Academy or Udemy, our offer incorporates real-world projects to give students platform specific skills, along with content that encompasses a broad-based understanding of the marketing ecosystem.
This template works, in my opinion, because it focuses on the industry your product is in, keys in on competitors so you have an eye on who you're competing with, and spotlights/forces you to think about what makes your product different.
Once you build this out you can start focusing on the tools that are best at reaching those customers and taking them through the customer journey of finding out about your product, wanting your product, and finally taking an action.

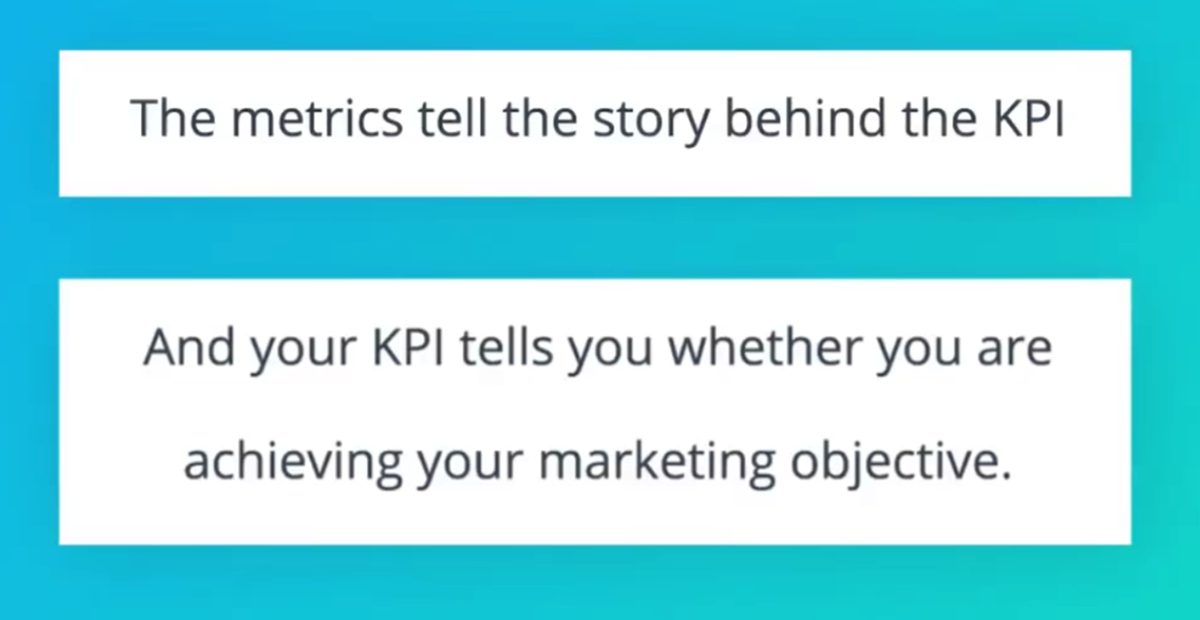
The program had many parts and below I plan to focus on my learnings in choosing key performance indicators (KPI), using marketing tools (moz, google adwords, semrush, etc.), and evaluating the KPIs using the tools I learned.
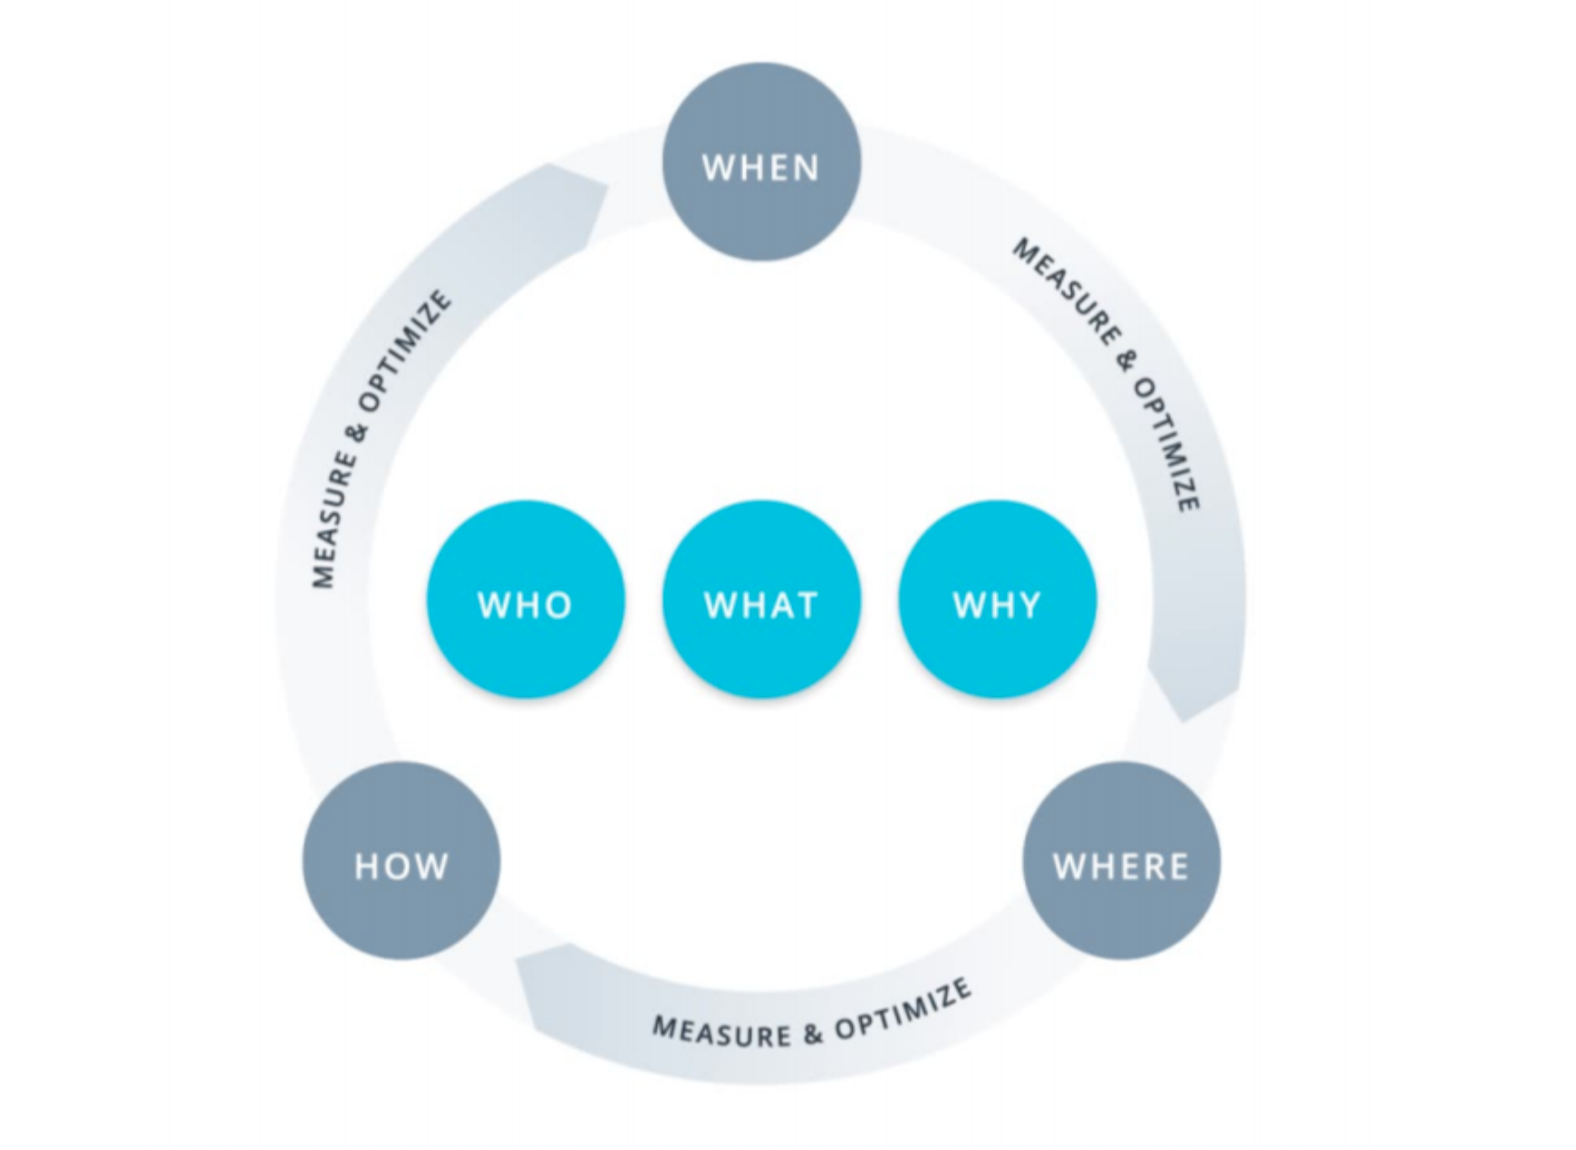
To build out KPIs I was presented with a marketing framework. This framework involved knowing the 5Ws and 1H of the company/product. What: what are you trying to sell? Who: who needs what you are selling? How: how do you structure a message that will reach out to them? Where: where do those customers get information, facebook, email, friends, etc.? When: when they are getting that information, at what stage are they when it comes to buying, are they ready to buy, are they browsing, or are they not even aware they have a problem? Measuring all this requires the metrics defined by the. Why: why are we marketing to them, is it to build awareness, to have them buy immediately, or to have them engage and learn more about what we have to offer? This why is the marketing objective you build your KPIs on to measure and evaluate success.
I used this workflow first hand in the program by building, executing, and evaluating a facebook ad.
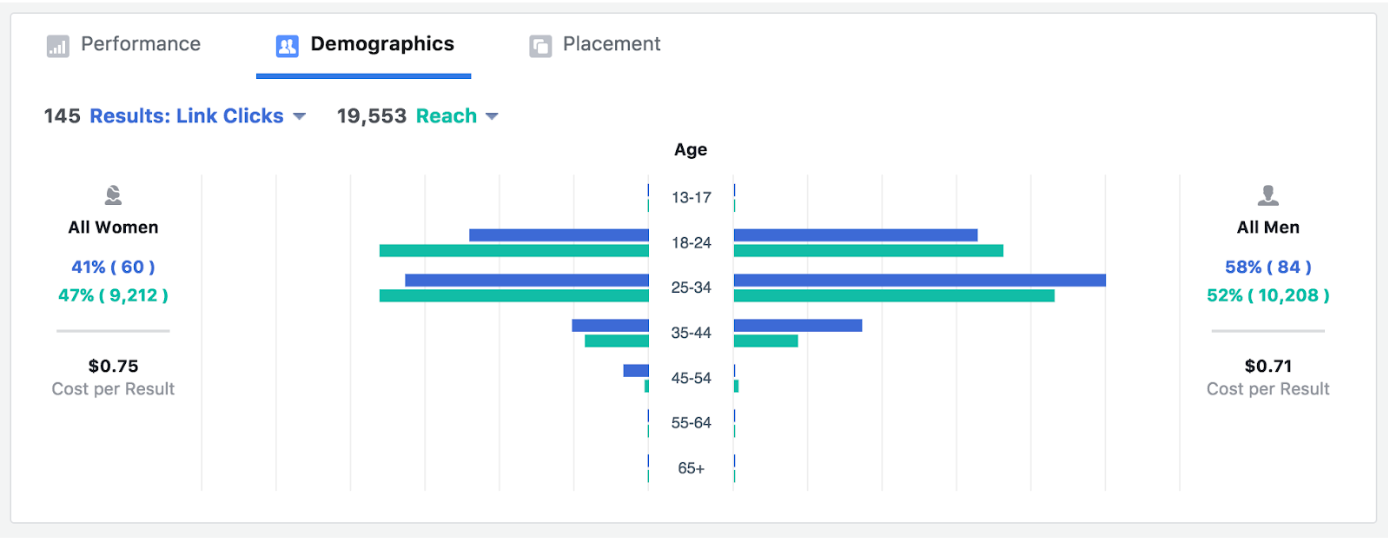
What I was selling was the Udacity nano-degree 3 month course. I was selling to consumers who were like me, around 22-29 year olds, who wanted more marketing experience. I decided to go with a message of aspiration and growth since reading stories of other people moving up in their careers through the program encouraged me to sign up. I was given facebook as the channel and since I knew it was a platform where people gather information, I focused my objective on getting people to take action to learn more about the program on facebook. My full marketing objective was:
Have 100 people click on the “sign up” link for the e-book throughout November 2018 at a $100 budget.
I wrote the copy and used the photos on the facebook gallery to create 2 ads for A/B testing.
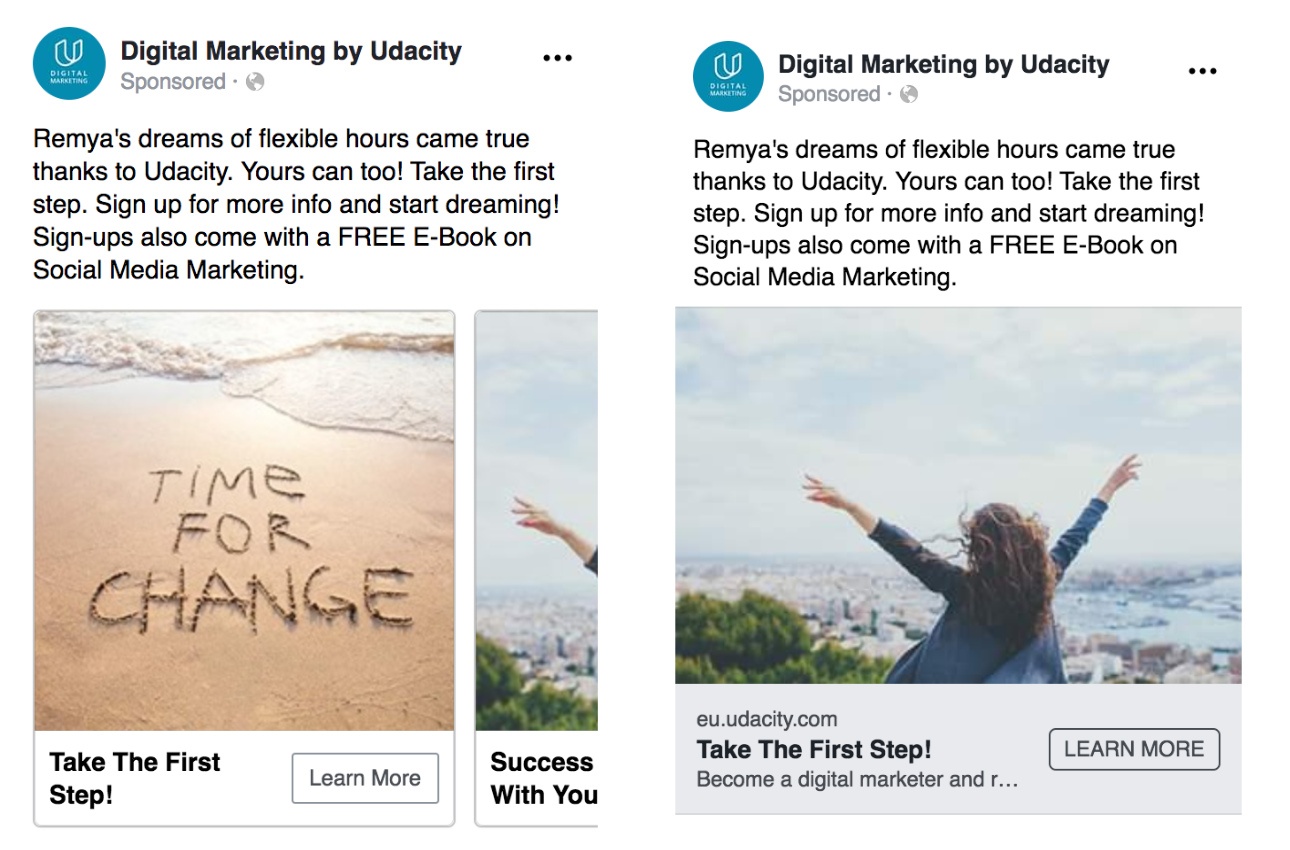
I ran the campaign for a week and at the end of the campaign, my results were as follows.
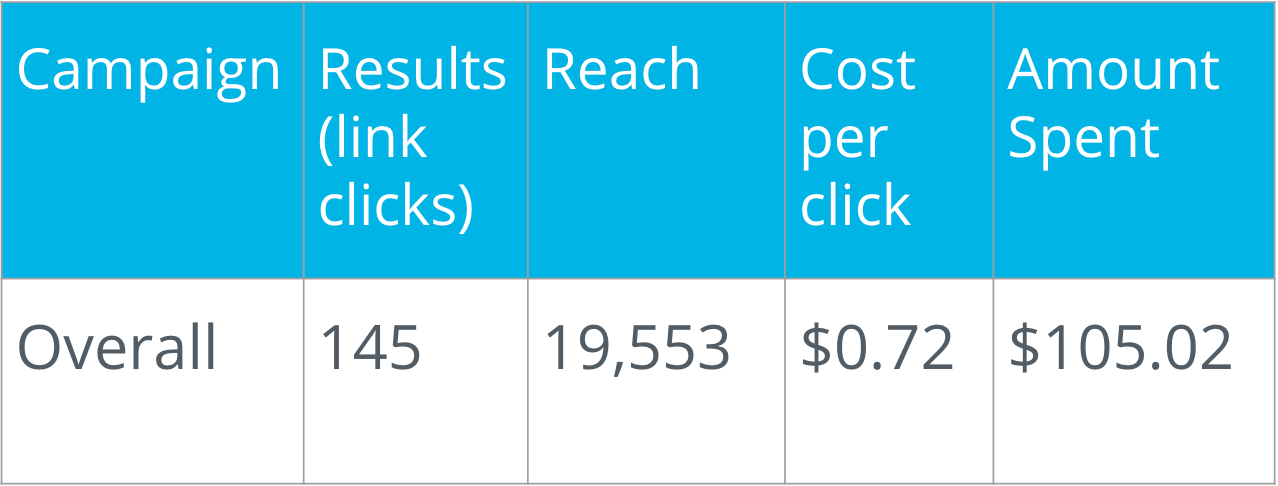
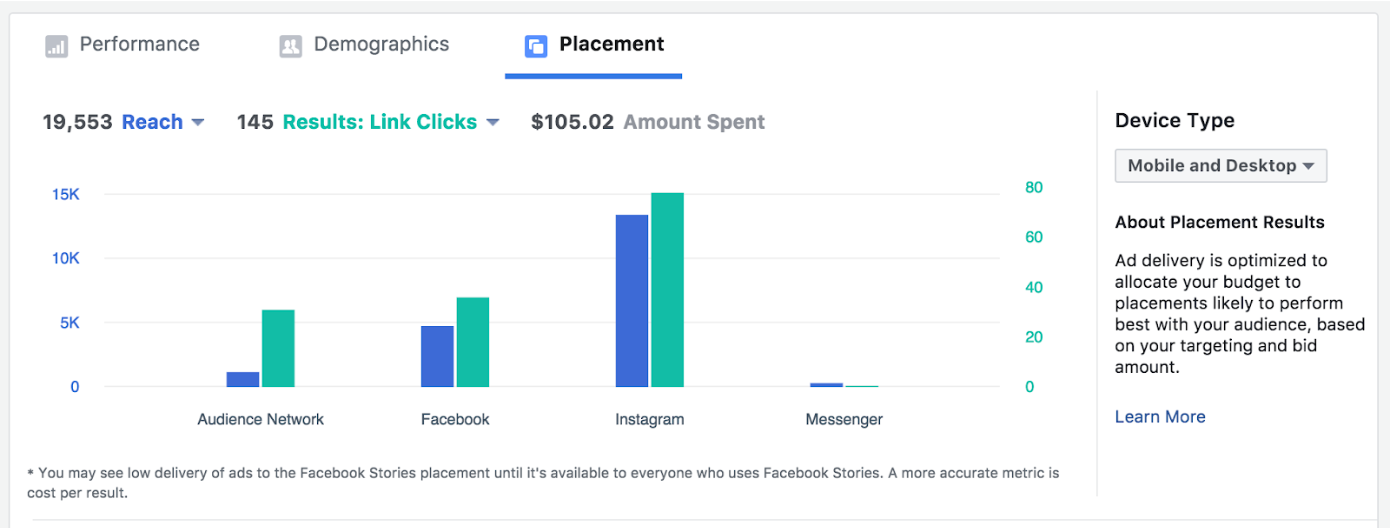
I went over budget by $5, but I surpassed my expected engagement by an extra 45 clicks. This was a success!
The next application of this was evaluating the SEO on Udacity's website. This involved evaluating work that was already done and seeing if there were ways to improve on it.

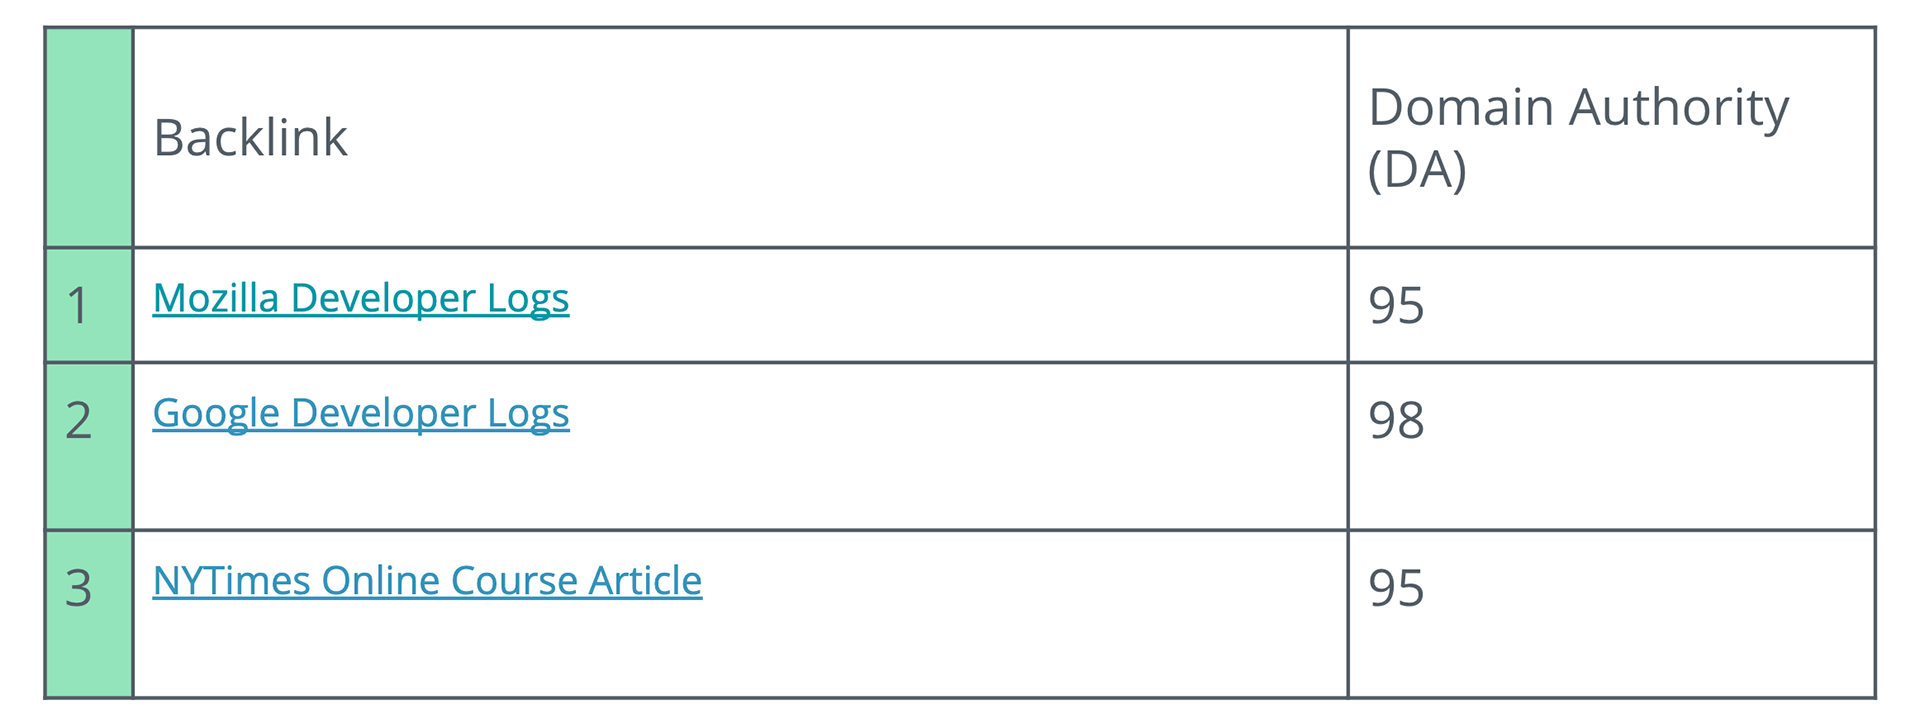
2 out of the 3 top backlinks, aka links that get people to the Udacity programs site, were developer logs. Most people doing the program will not be developers, so while it is beneficial to be on a google and mozilla webpage, publications like NYTimes would led to a stronger conversion.
With that in mind I made these three website recommendations.
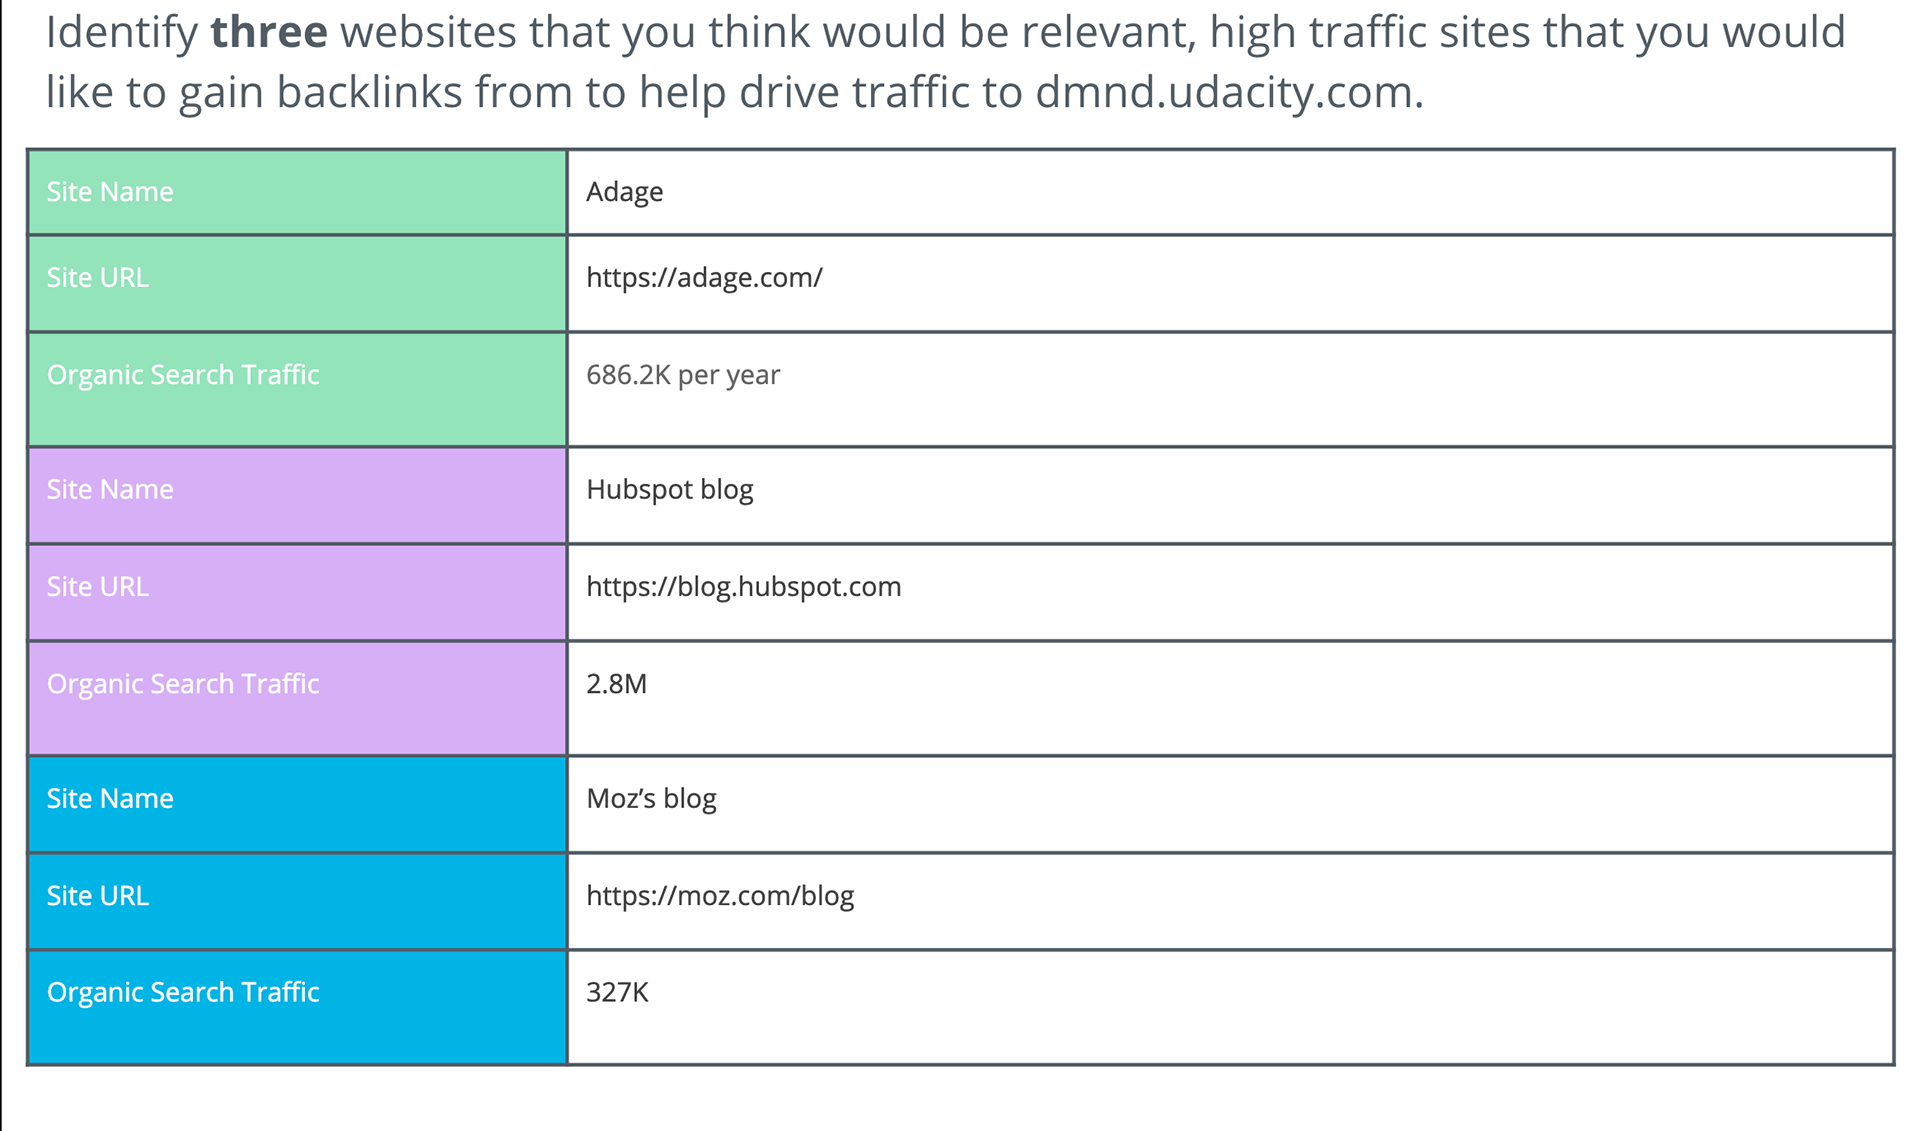
These are websites focused on marketing where people looking to expand their careers would potentially land. Seeing the program prominently on these sites would lead to higher conversion potential.
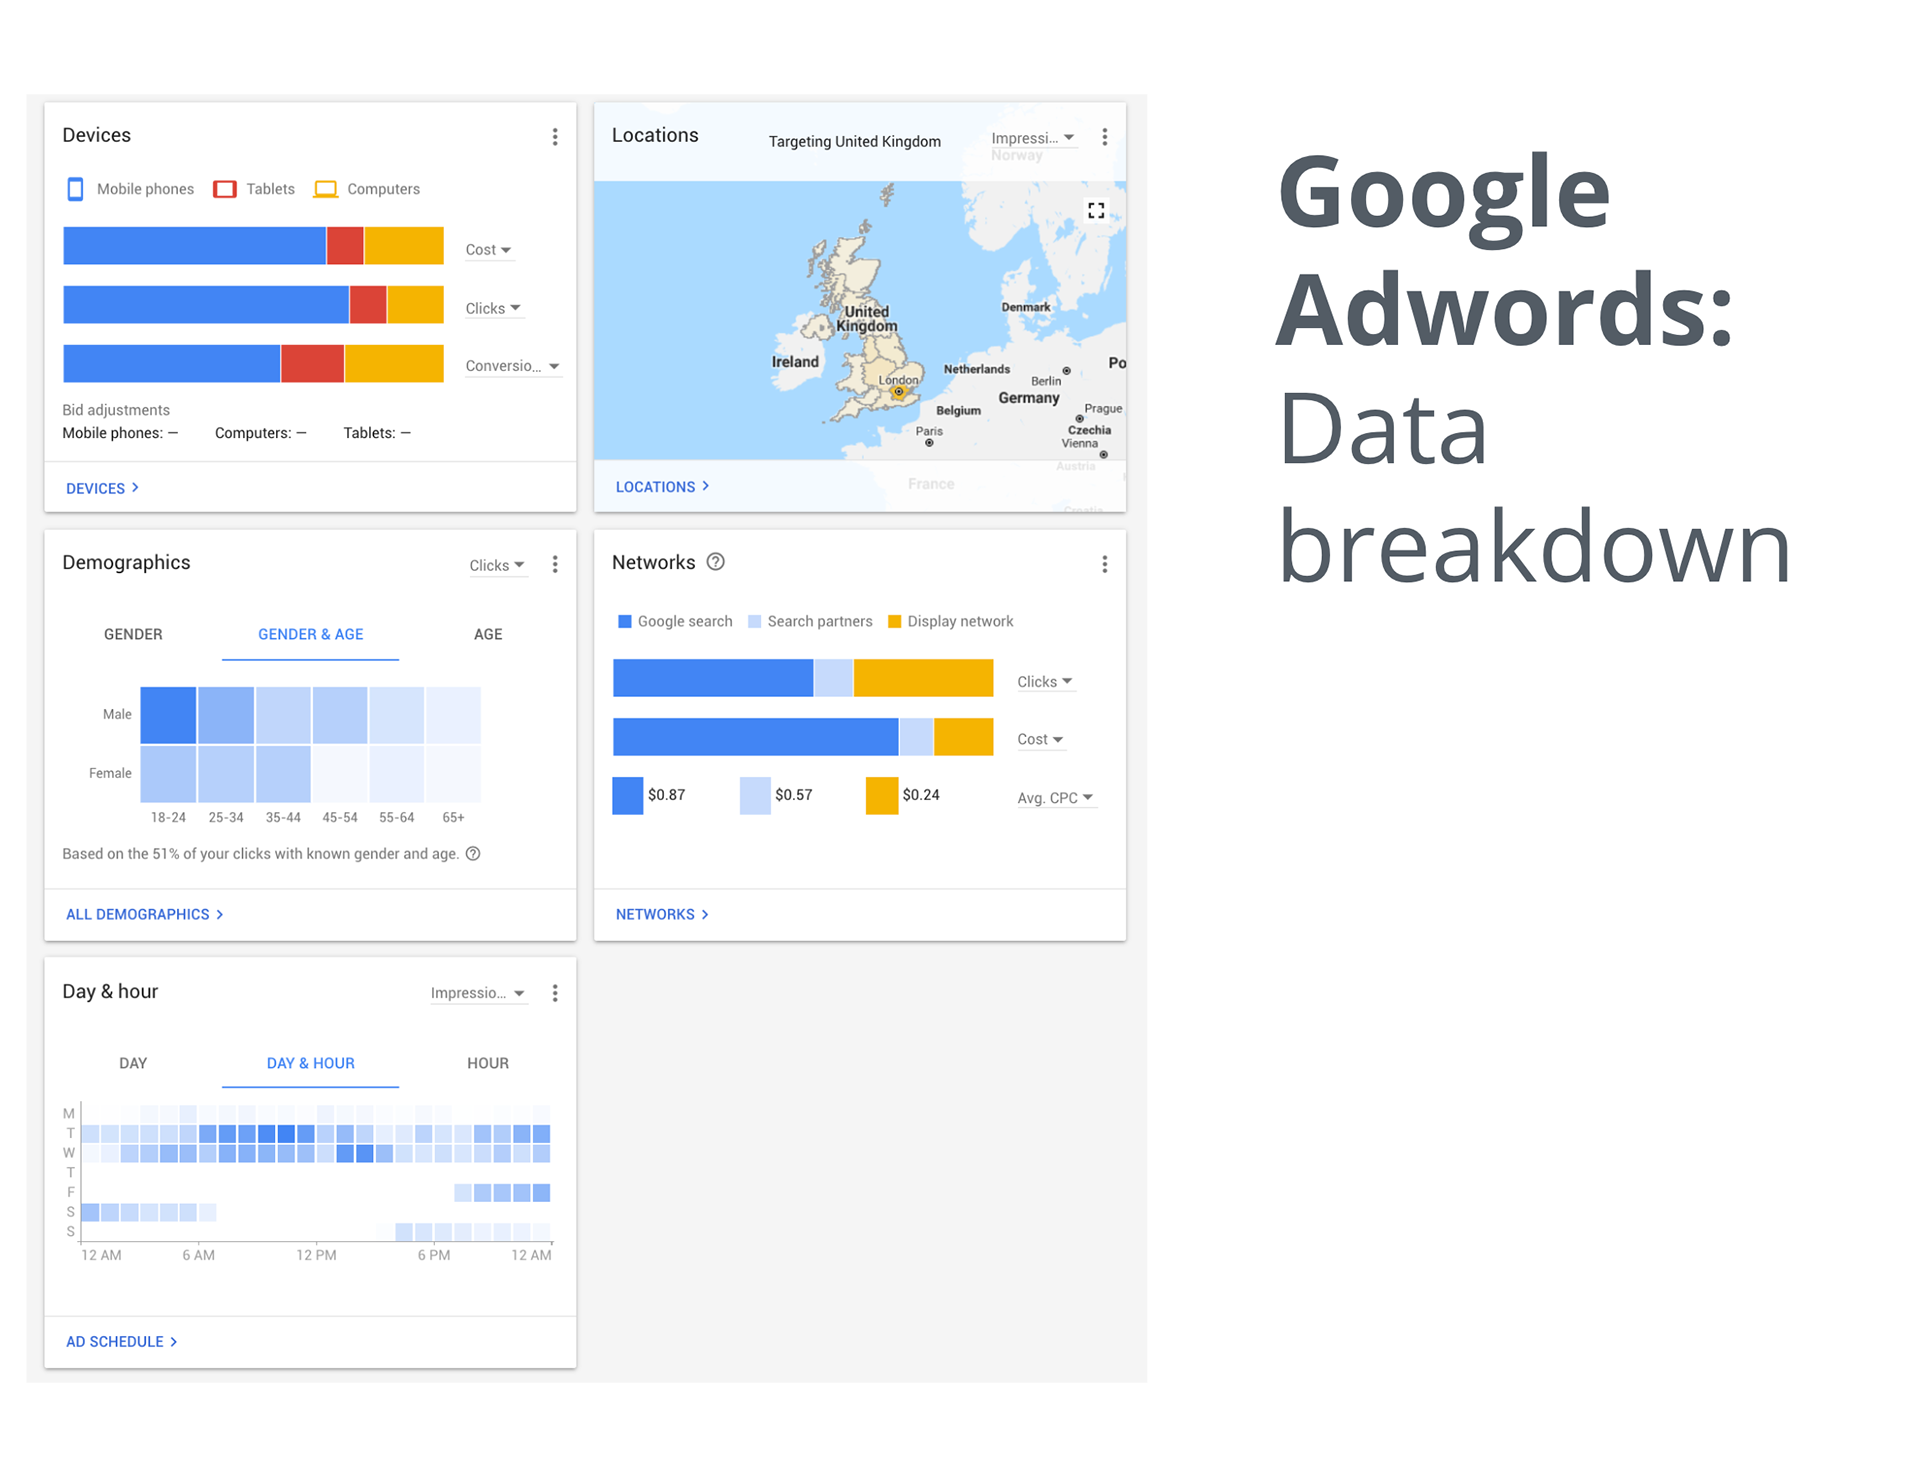
Putting my facebook campaign skills together with my keyword research on Moz and SEMrush, I was tasked with running a google adwords campaign. This put together the data analytics of the facebook campaign and the keyword thinking of the SEO analytics. My marketing objective for this task was:
Obtain 15 clicks to the free HTML5 course from google search ads during December 2018 with less than $100.
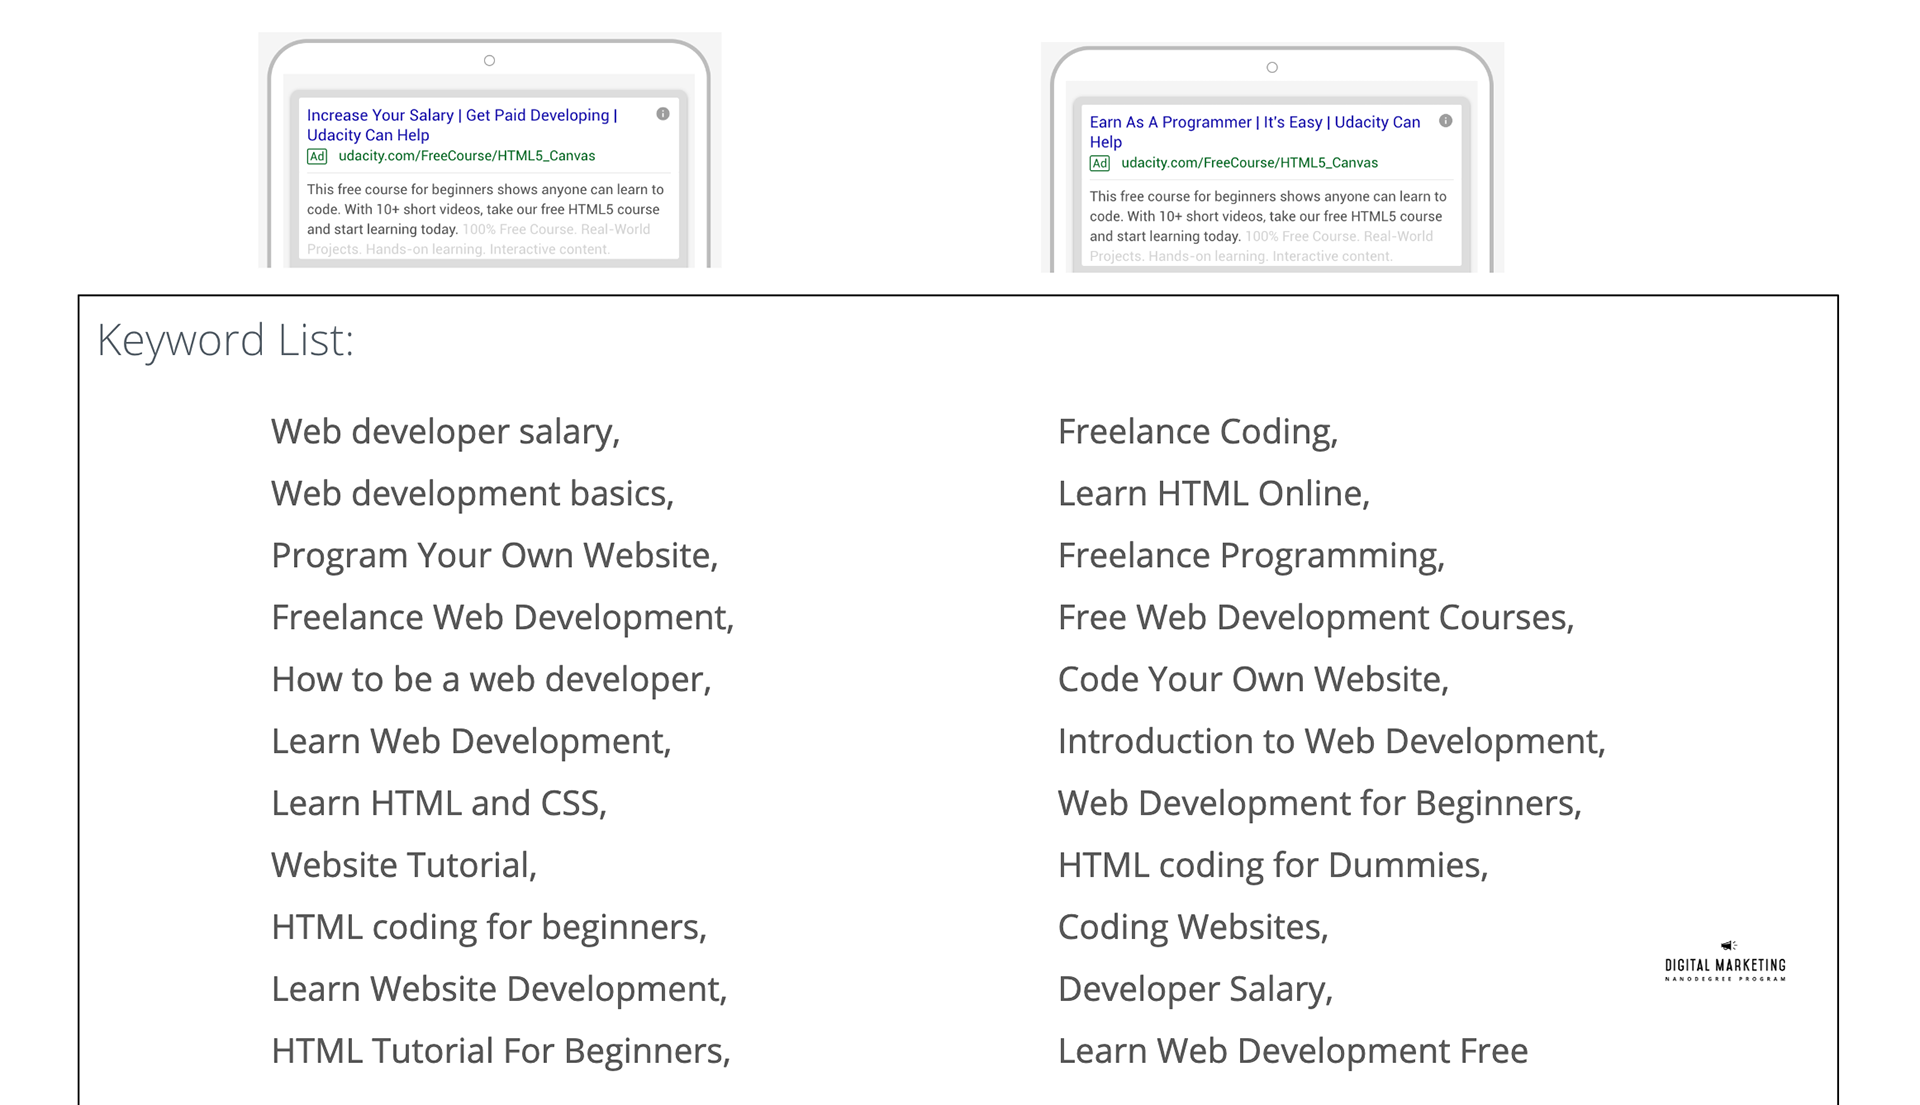
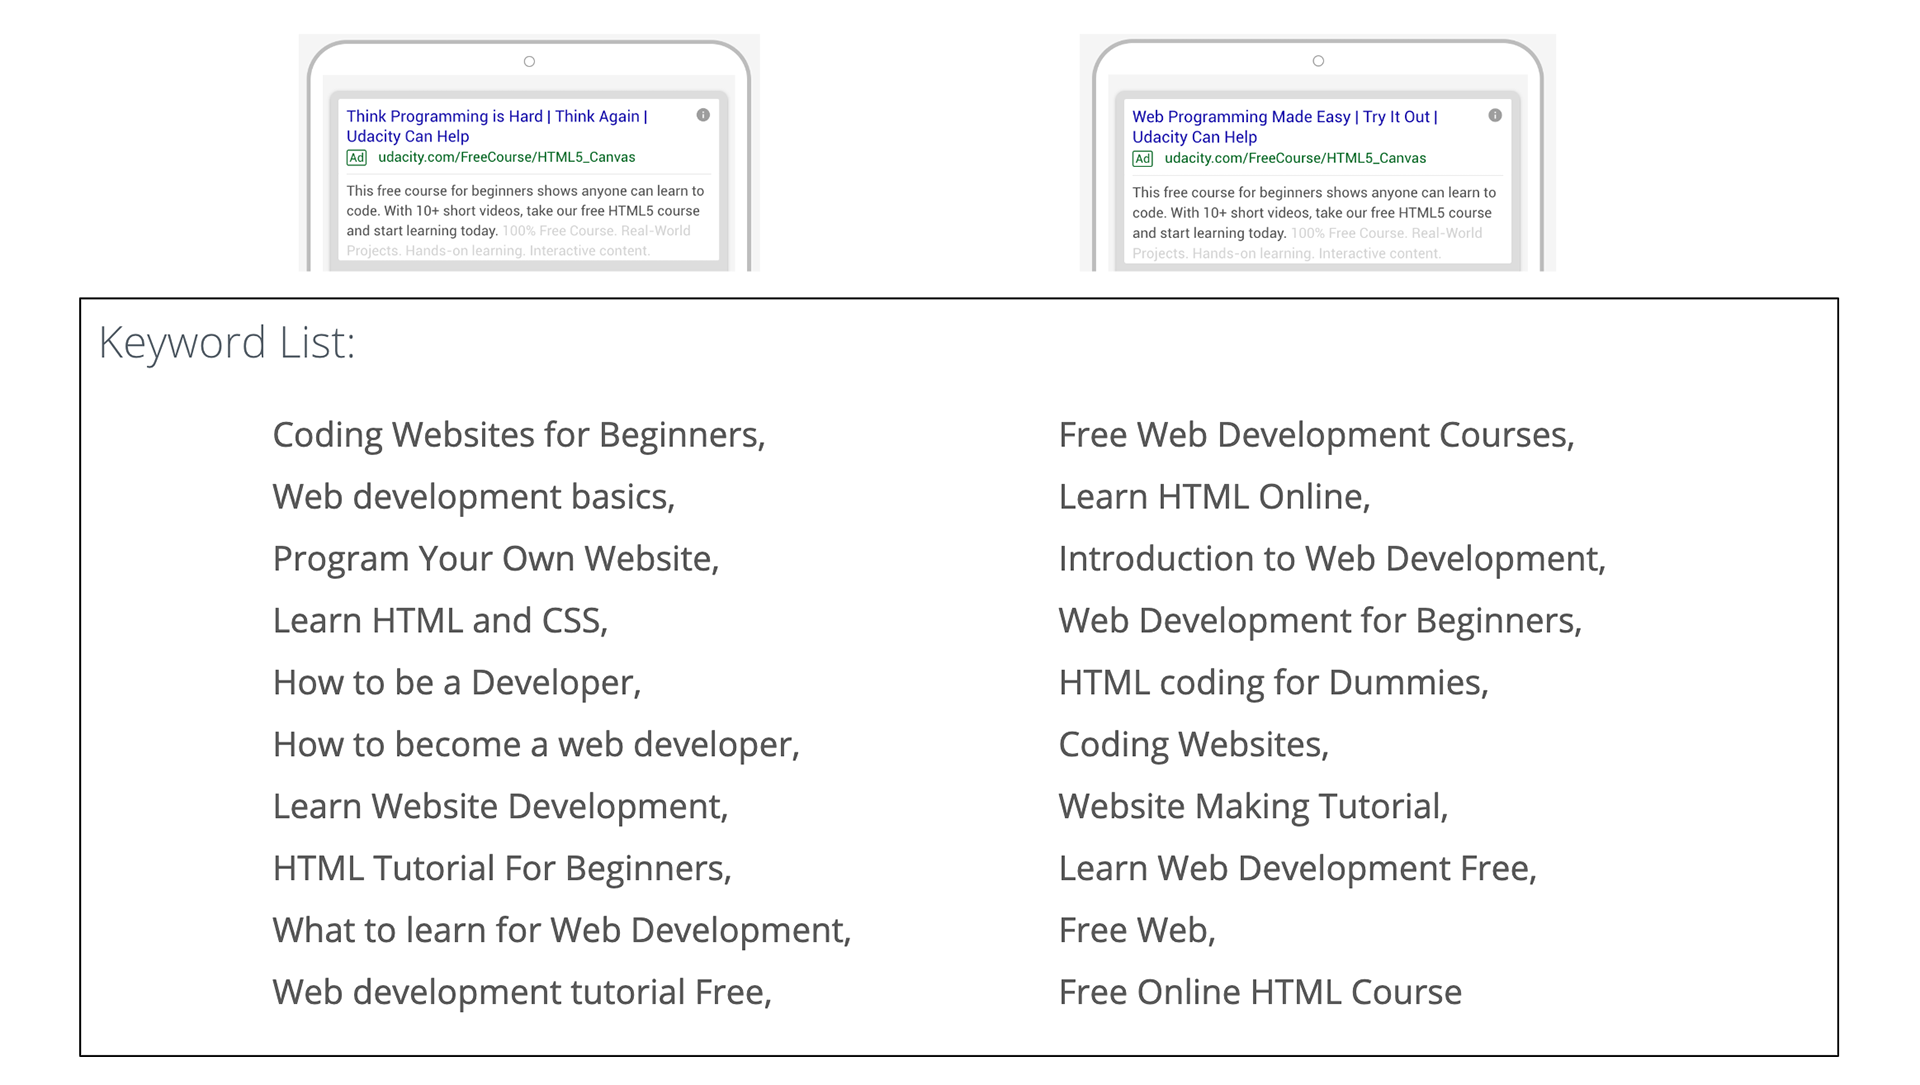
I broke the campaign into two sub groups. Those who were curious about web development and programming, the first keyword list below, and those who were actively seeking web development resources, the second keyword list below.
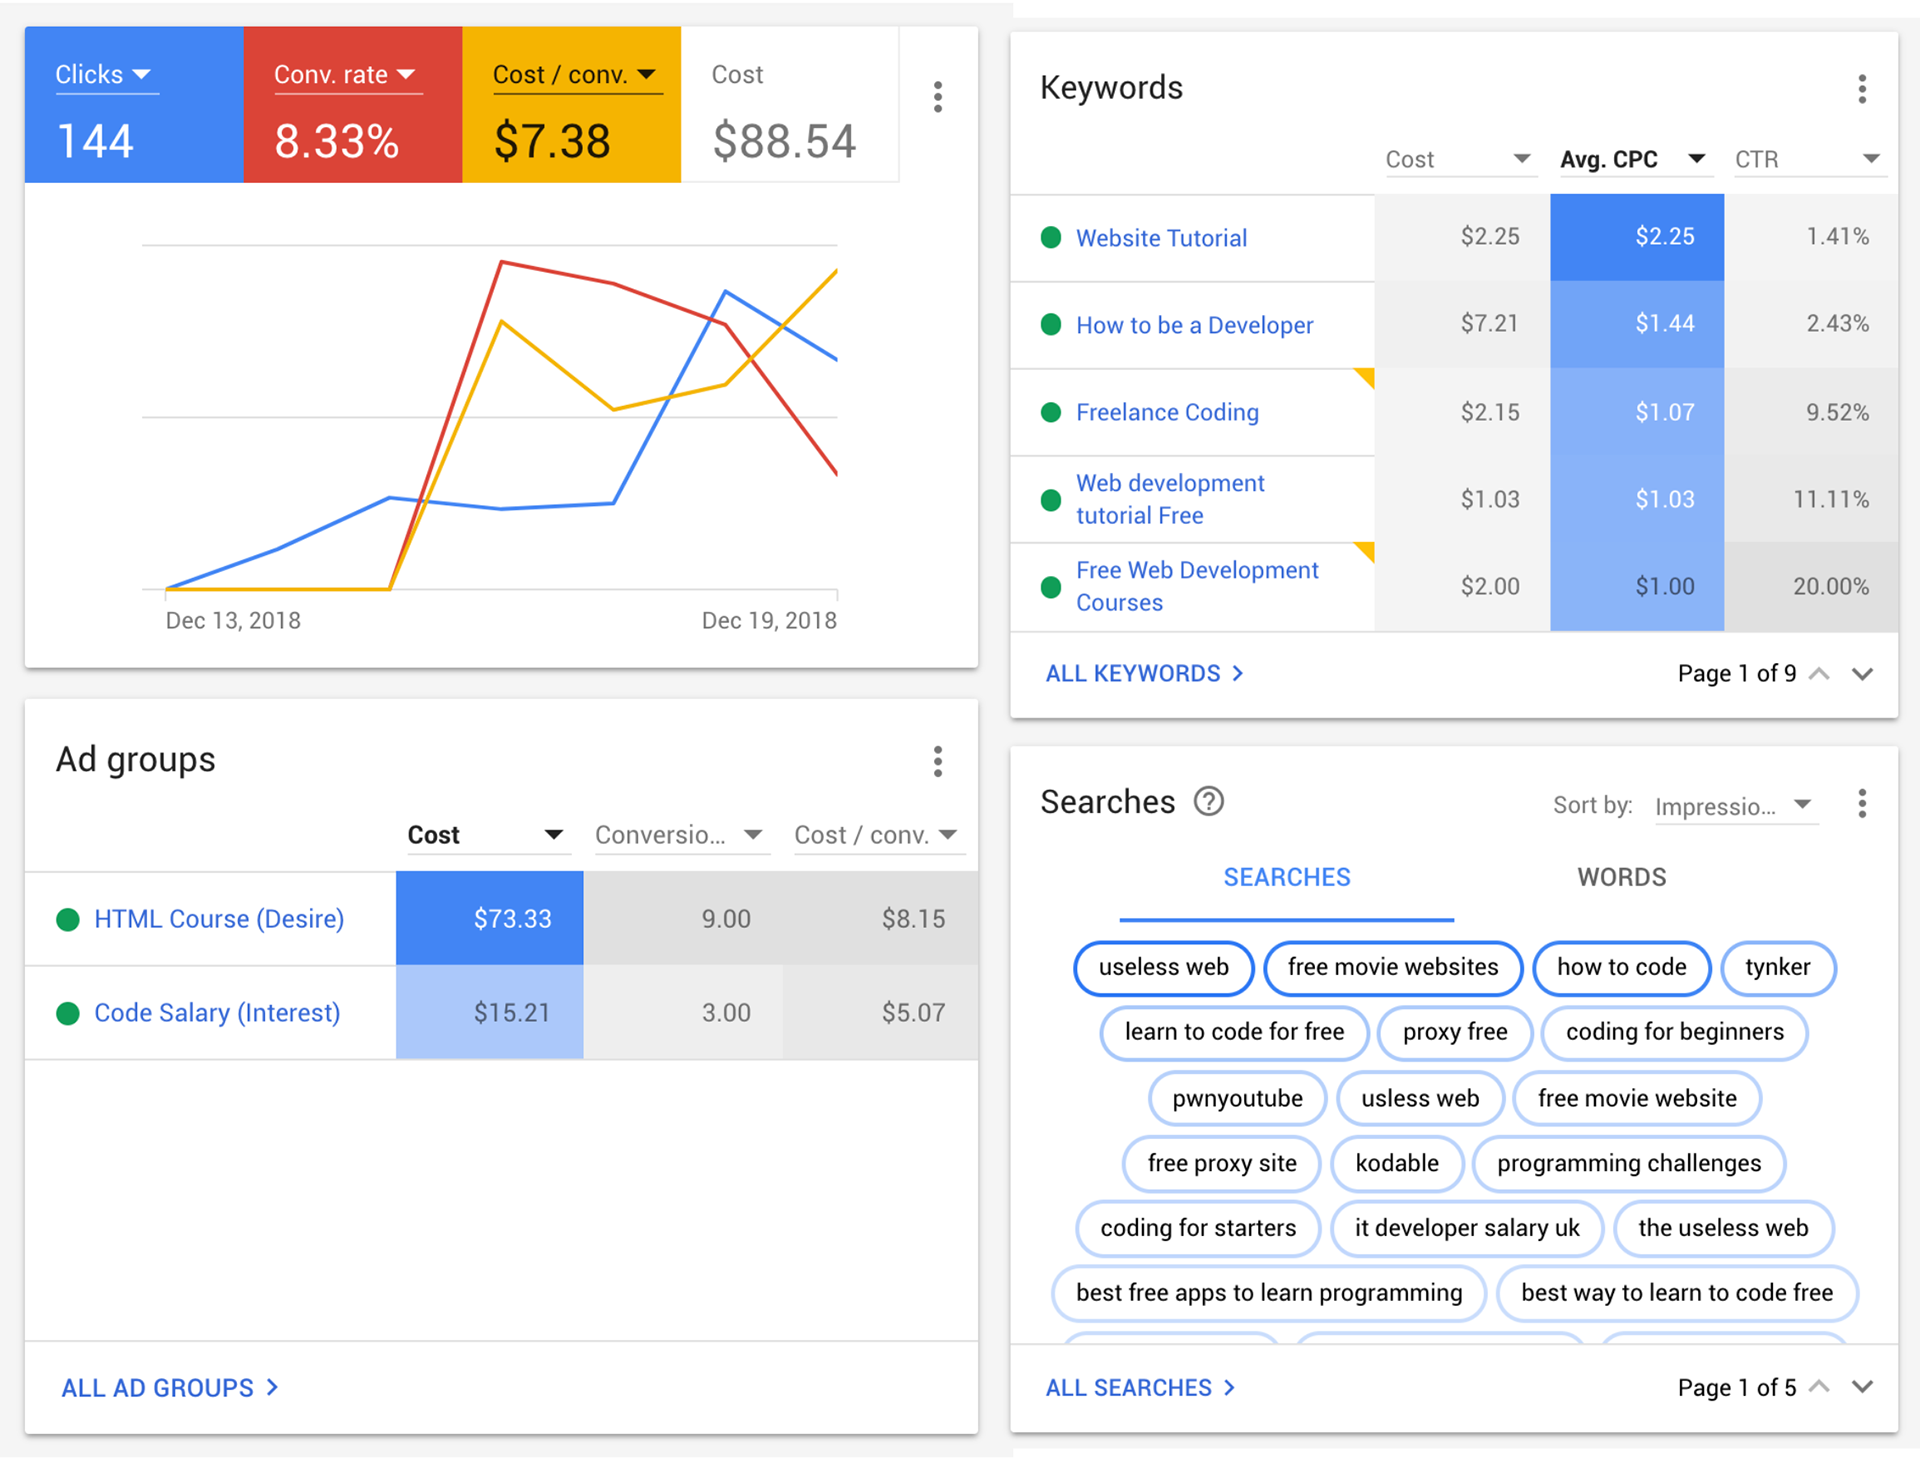
With a KPI of getting 15 clicks to the free HTML course, my result of 144 clicks destroyed my low expectations.
Additionally I was not expecting any conversions, so a conversion of 12 people signing up to take the course was also an indicator that I had chosen good keywords.
I spent on average $0.61 per click which is $0.10 over my max CPC (cost per click) bid. The CTR (click through rate) of 1.75% makes it feel worth it though.
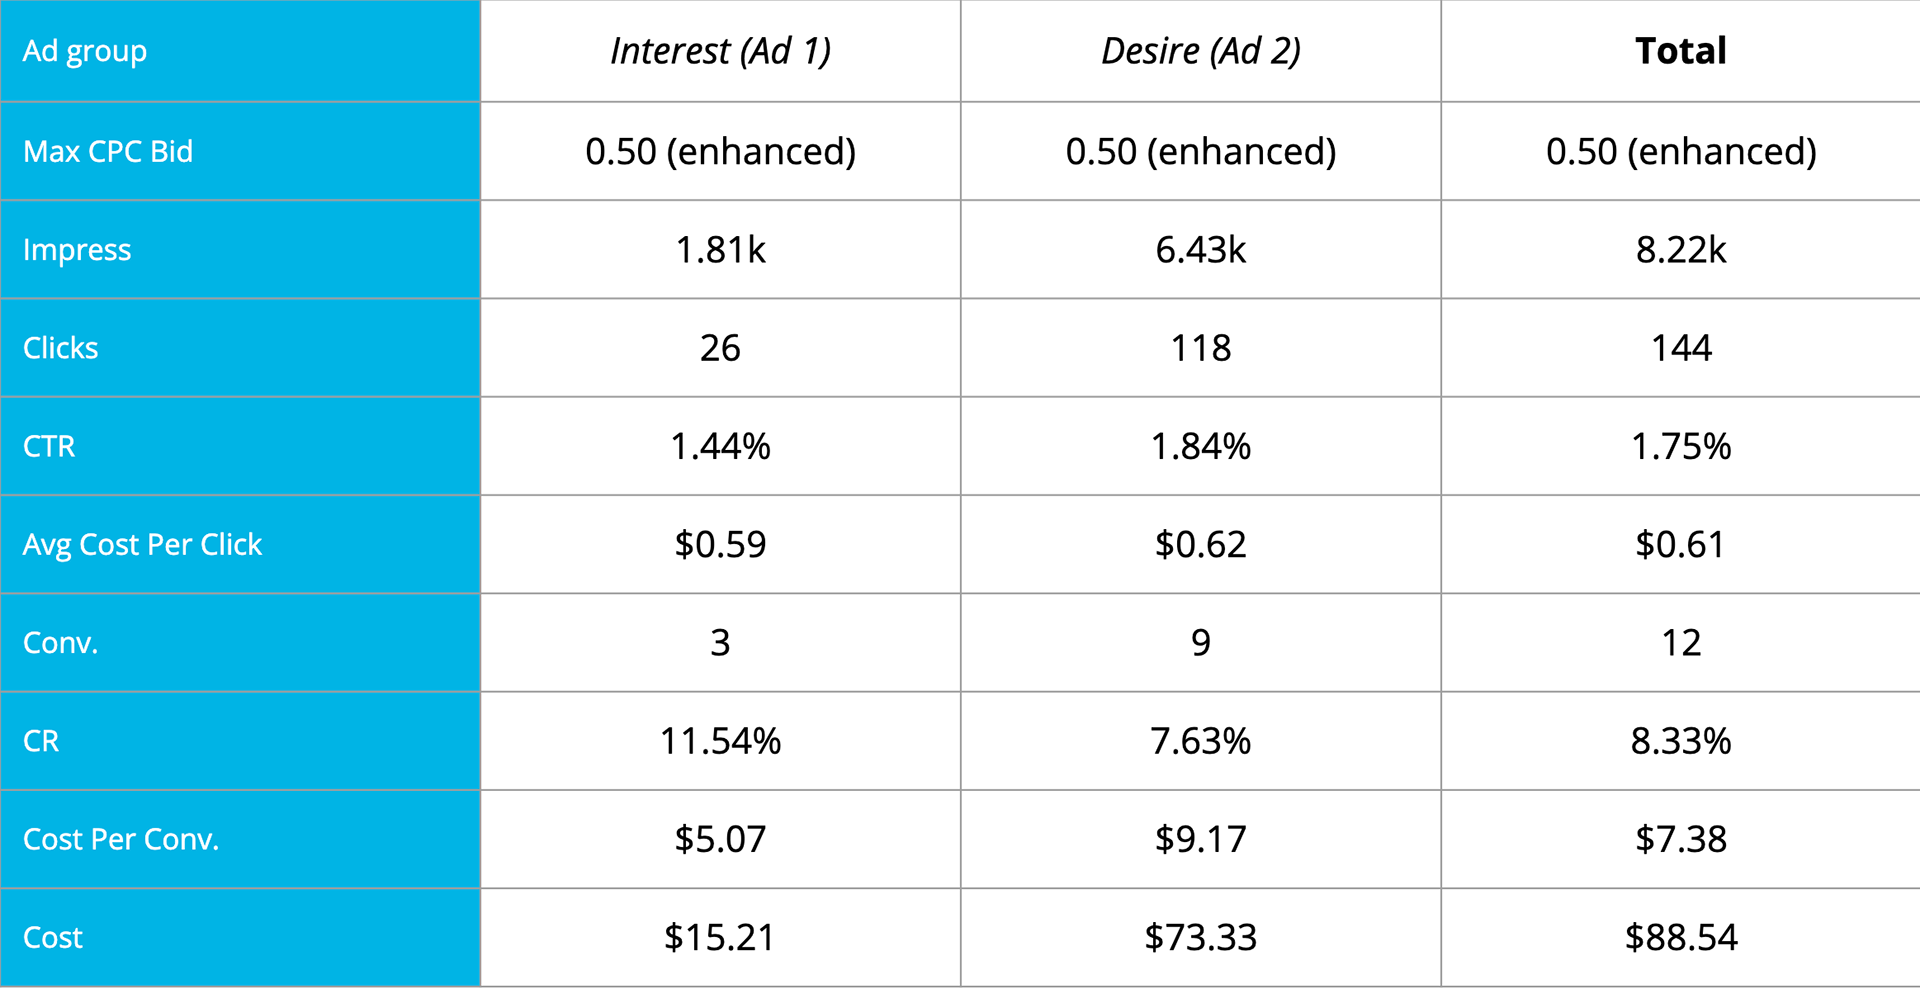
My desire ad group had a better CTR of 1.84% compared to 1.44% for the other ad group. Yet the CR (conversion rate) of my interest group was 11.54% compared to a lower 7.63% for the desire group. I think this is because people in the desire stage know of other resources for web programming and therefore compare with a sharper eye, whereas people are curious who click the ad have less programs to compare it to and therefore sign up since it is free.
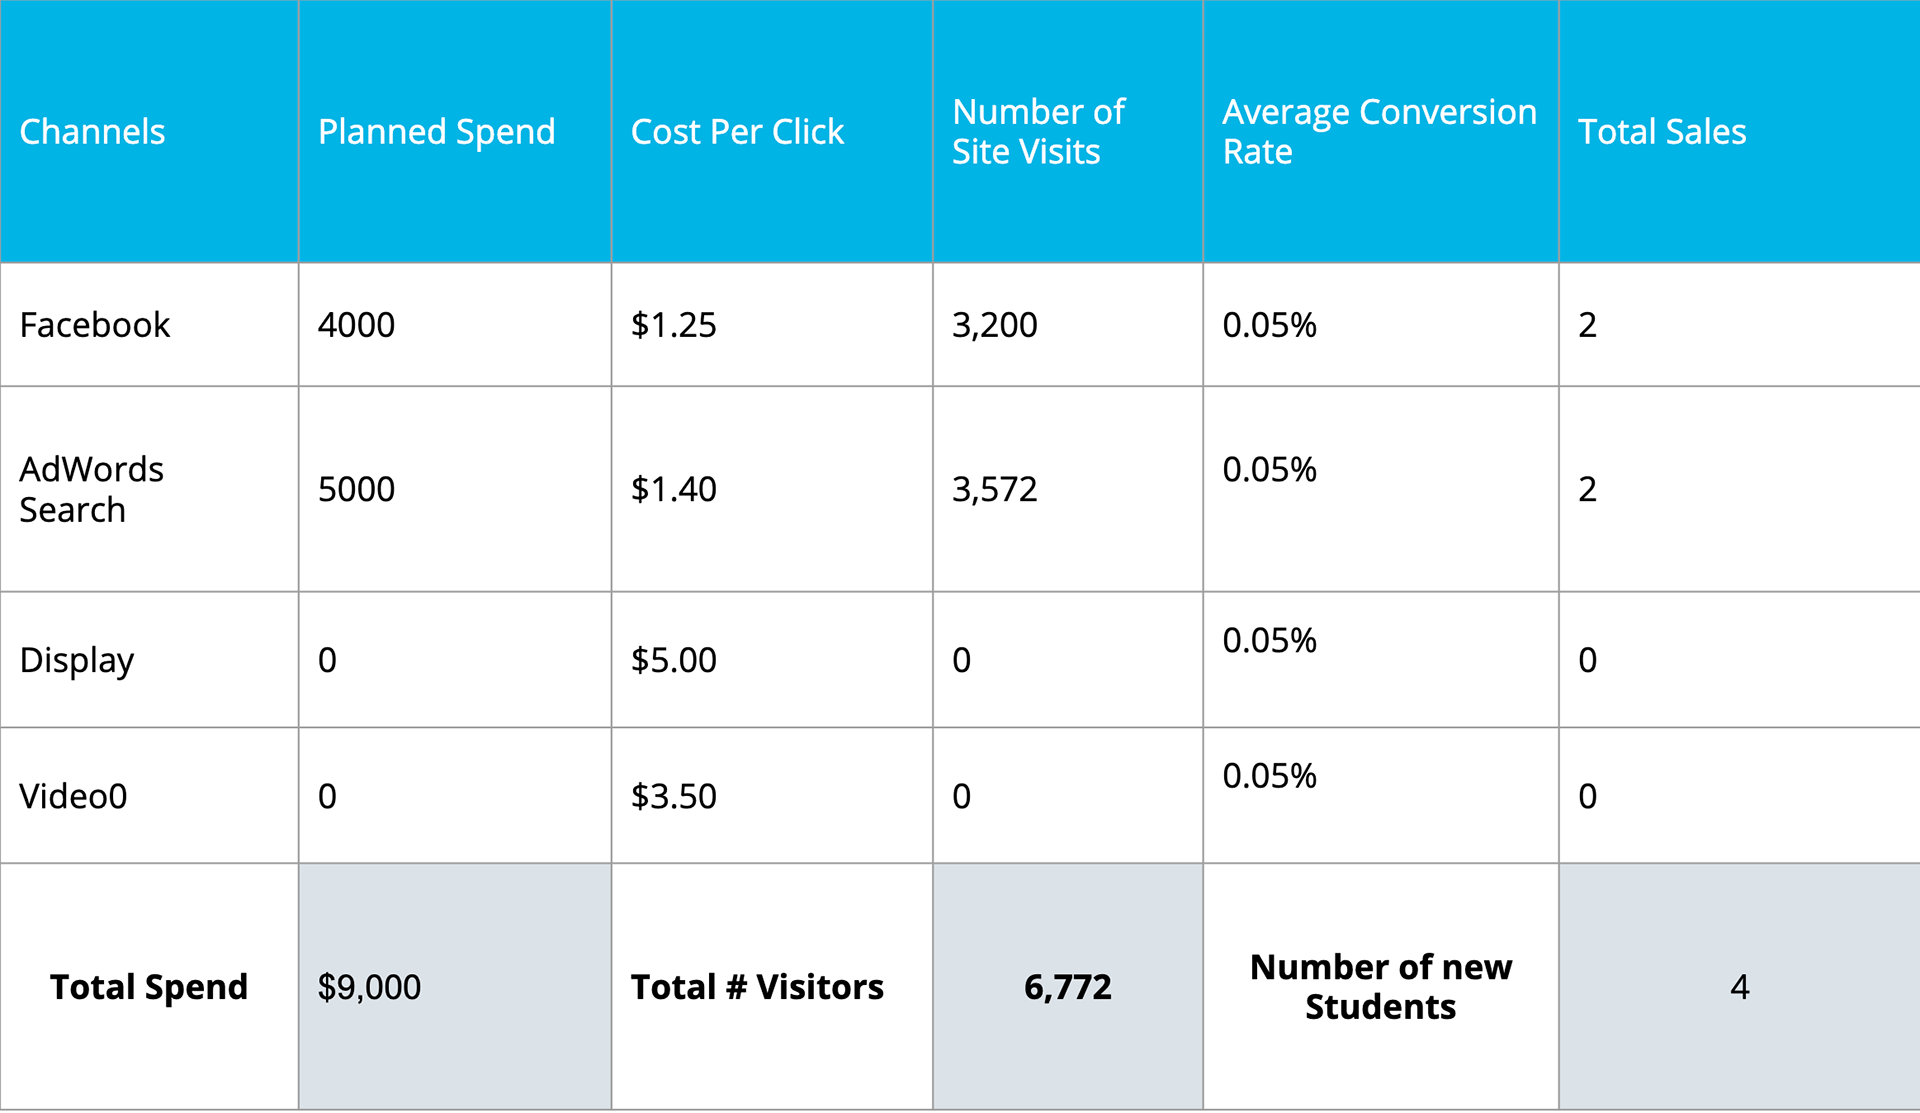
Pulling together the data I gathered from the google adwords and facebook campaign and few other campaigns in the program, I was able to extrapolate what a $50,000 media spend would look like for the final assignment. The cost of the Nanodegree is $999, and we assumed a profit margin of 30%, meaning that Udacity makes $299 in profit per student that signs up.
Awareness: Budget Allocation for Media
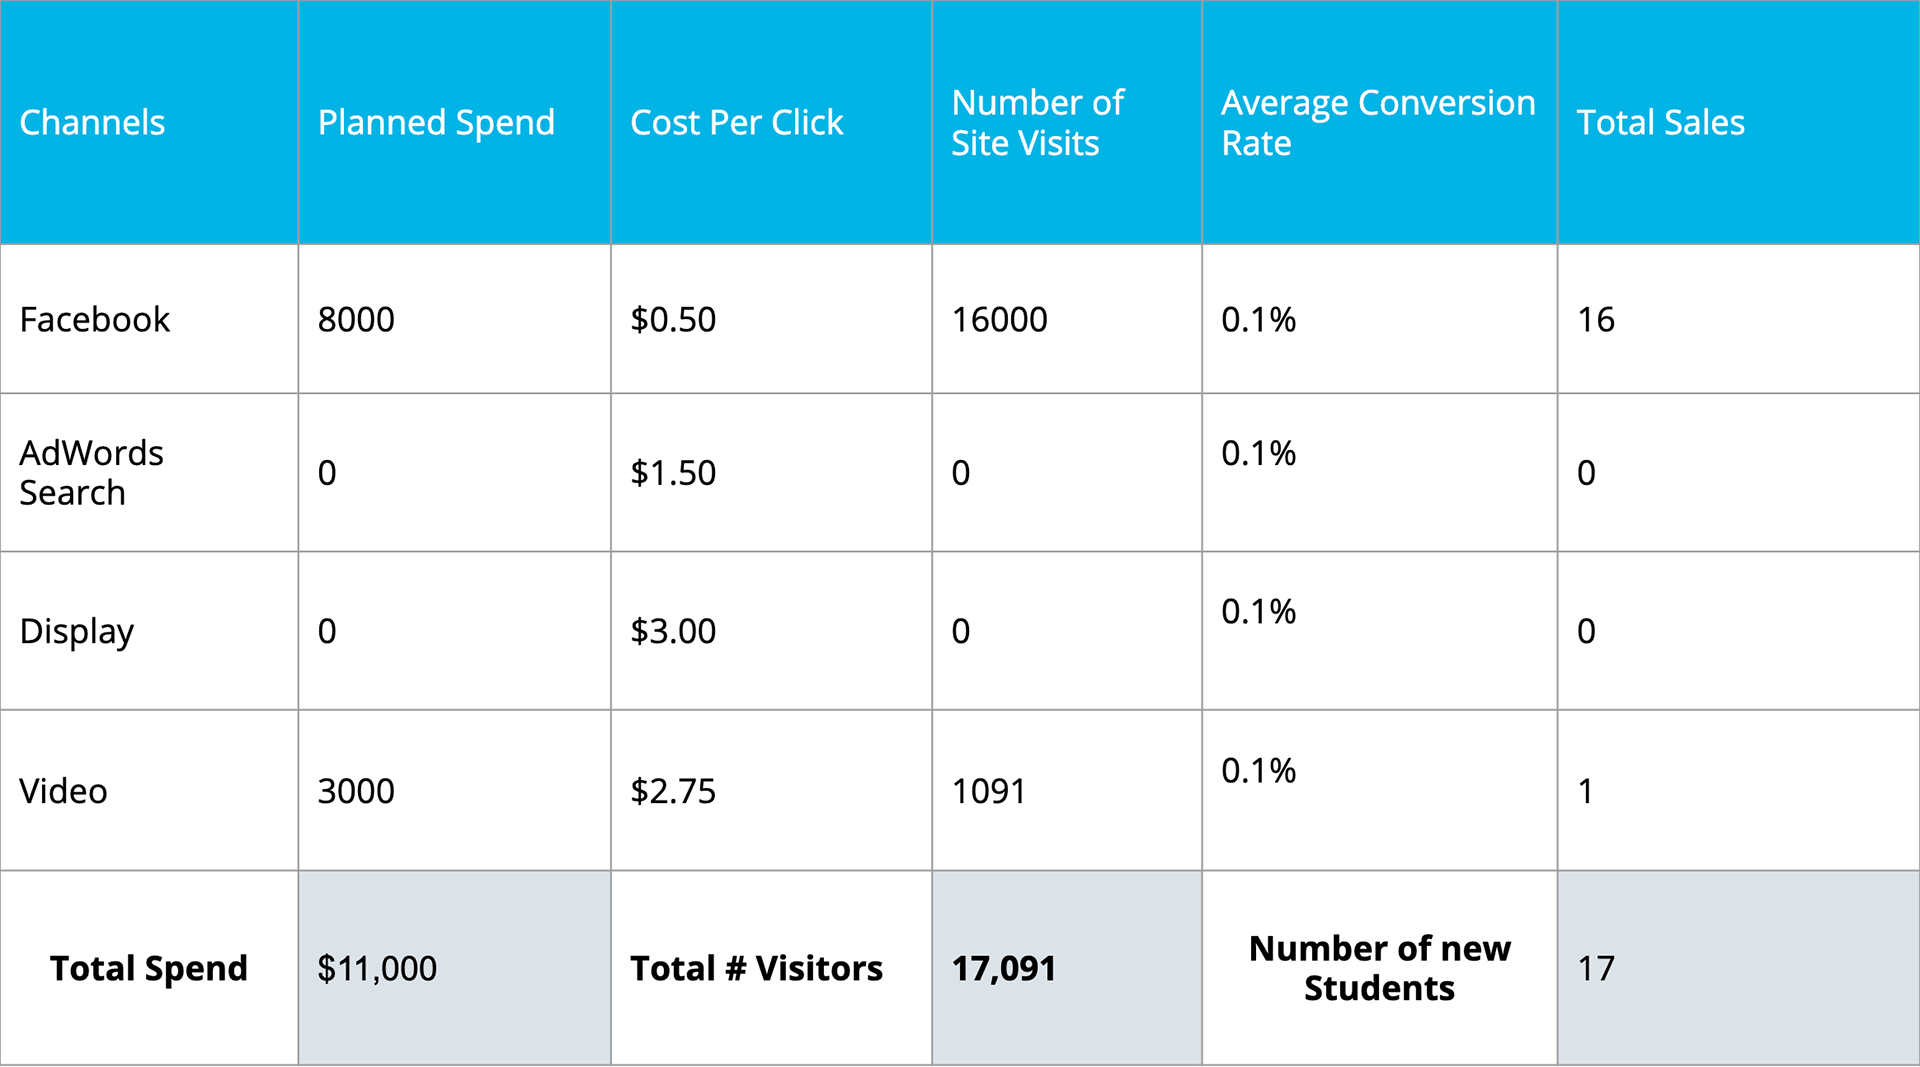
Interest: Budget Allocation for Media
Desire: Budget Allocation for Media

ROI: Budget Allocation for Media
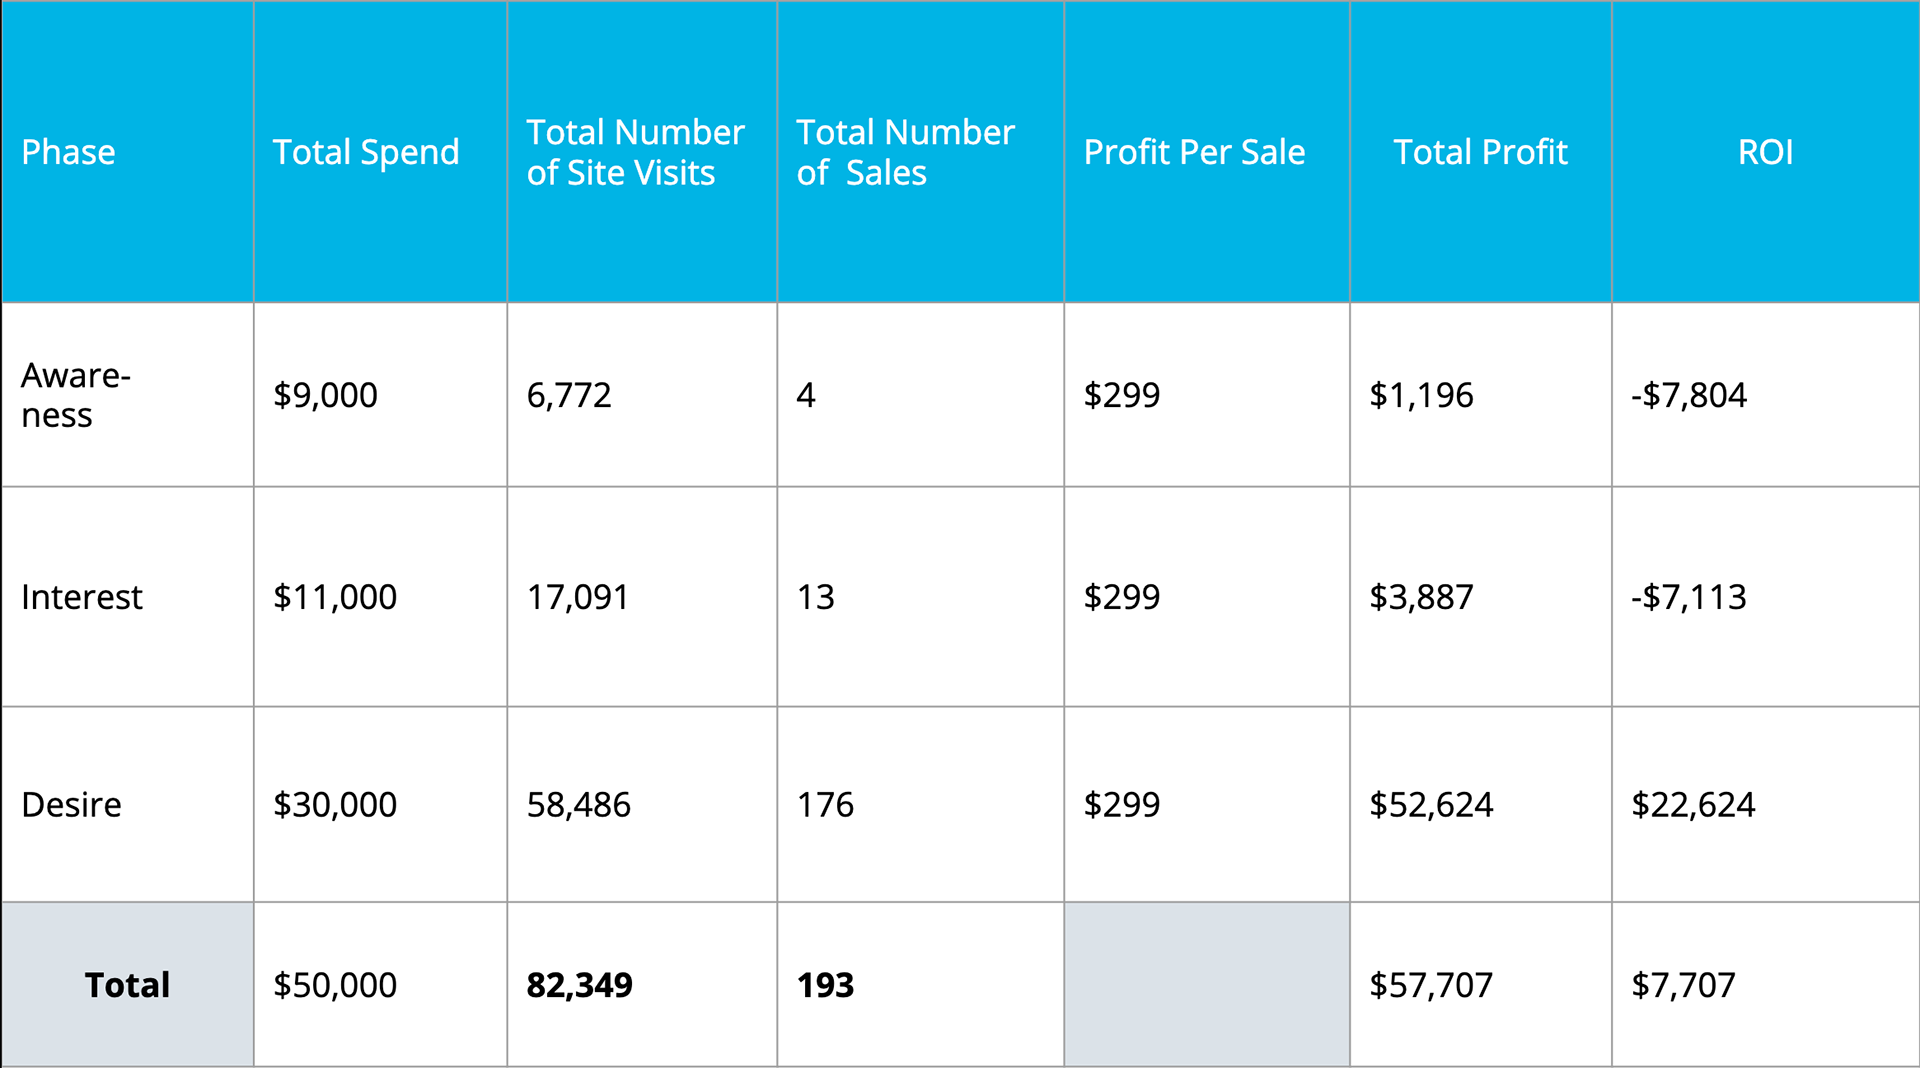
While there is a lot more profit gained in the desire stage, I still focused some spending on awareness and interest to get students aware and interested in the program. Spending to bolster the entirety of the customer is what yields the best result. We still want to aim for profits though and therefore I put more than half of my spending on converting those seeking a marketing program.
This was an overview of the planning, execution, and evaluation methods I learned through the Udacity program. You can read the full documentation of the work I did in the program here, which includes doing customer discovery, writing blogs, evaluating display ads, and more.